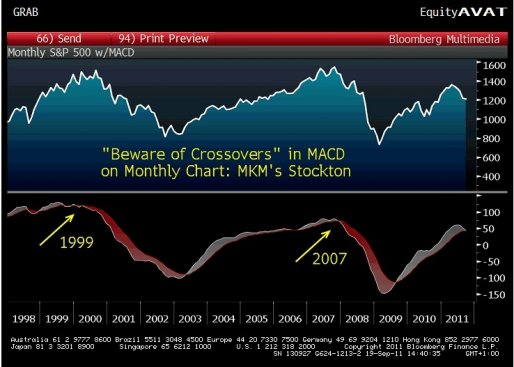
"Albert Edwards has been hard at work in recent weeks studying the technical landscape and the uber bear has found what he claims is more evidence of the peak in the bull market within a secular bear market. In two separate research notes this week he described two popular long-term indicators which appear to be giving an early warning signal. The first signal is the monthly MACD which is giving just its third sell signal in the last 15 years (via Business Insider):
at http://pragcap.com/killer-waves-and-dangerous-macds
“The chart below shows the monthly S&P together with the MACD.
For those normal people who don’t know what the MACD is or even what it stands for, it is the Moving Average Convergence-Divergence. It is a momentum oscillator closely followed by many market participants. When the faster moving mav breaks the slower moving mav (up or down) we get a key buy or sell signal.
We may be about to break downwards on the monthly S&P chart which would give us a HUGE sell signal as was the case in Nov 2007 and the end of 1999 (also see attached note on The Killer Wave signal). If the S&P cracks we will be at 1.5% 10y US yields within a few days and probably heading to 1%. Watch this space.”
at http://pragcap.com/killer-waves-and-dangerous-macds
