James Turk: “Economic activity in welfare states around the globe is stagnant, Eric. That means living standards are declining. Even more worrisome are the years of profligate, runaway spending by politicians in these welfare states that have created an unserviceable debt burden…
Central banks have been trying to paper over these problems, but to no avail. Despite the cheerleading by vested interests, unemployment remains high in the overleveraged welfare states in Europe and of course the United States. All the central banks have managed to do is destroy wealth with their zero-interest-rate policy.
That’s One Scary Looking Chart
So far the newly created money from various QE programs around the world has had limited impact, but actions have consequences. In this regard, I am watching the following chart of money velocity. It is a scary chart, but what is it really telling us?
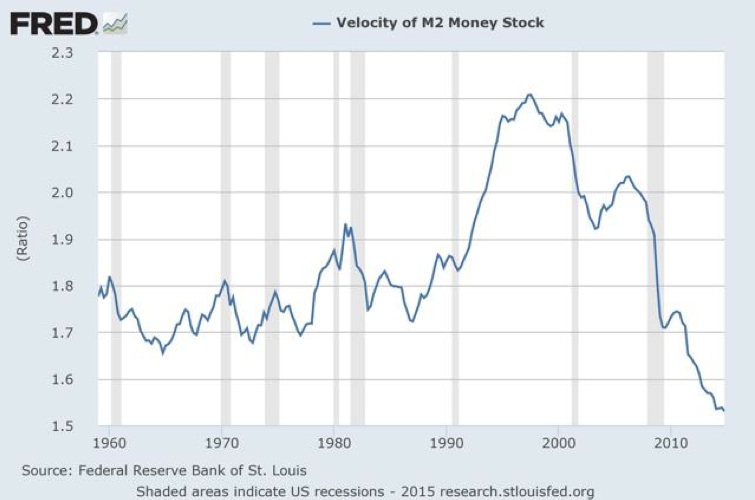
Velocity is in effect gross domestic product divided by the quantity of money in circulation, which in the above chart is M2, itself a broad measure of the total number of dollars.
This decline in velocity is usually viewed as a signal for a decline in economic activity because currency is not being spent fast enough. But I see it differently.
Currency and the goods/services being measured as economic activity are different sides of the same velocity equation. So saying currency has to circulate more rapidly is no different than saying goods/services have to be purchased more frequently, neither of which mean anything useful.
So rather than being any indication of economic activity, the importance of this chart to me is what it is telling us about the demand for currency.
This chart doesn’t measure absolute demand, which is impossible to do anyway. But it does provide an indication of the demand for the amount of currency in circulation..."
at http://kingworldnews.com/a-scary-looking-chart-that-explains-why-this-will-be-a-different-kind-of-collapse-than-people-think/
No comments:
Post a Comment