"Our friend Ronald Stoeferle has emailed us some compelling evidence which suggests the gold bull market is far from over. In fact, his work shows that gold is still significantly undervalued.
Rather than looking at the nominal prices, Mr Stoeferle has decided to carry out comparisons against monetary aggregates and other asset classes. This is key in gold price analysis as it puts the price of the metal into perspective alongside fundamentals which are heavily influenced by both monetary policy and confidence in the economy.

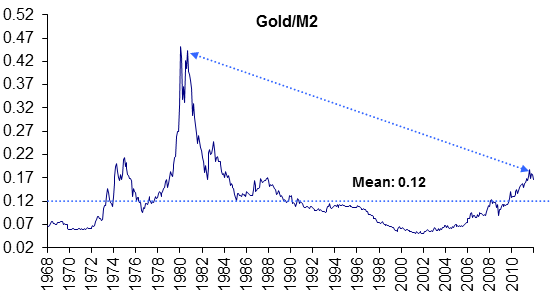
The first chart shows the Gold/M2 ratio. The ratio currently trades at 0.16, which as Mr Stoeferle points out:

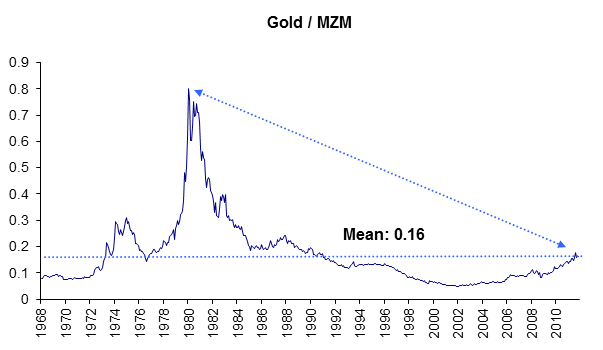
MZM, the Money Zero Maturity measure, measures the liquid money supply in an economy. For some countries it is the preferred money supply as it measures the money which is readily available in the economy.
This demonstrates the difference between the value of gold and the money supply as even more extreme version of the earlier graph; the ratio of gold price to MZM is trading at the long term mean of 0.16. This again, is significantly off the 1980 ratio of 0.8.
Mr Stoeferle states that in order for the 1980 ratio to be matched today, the gold price would need to increase to $8,500.

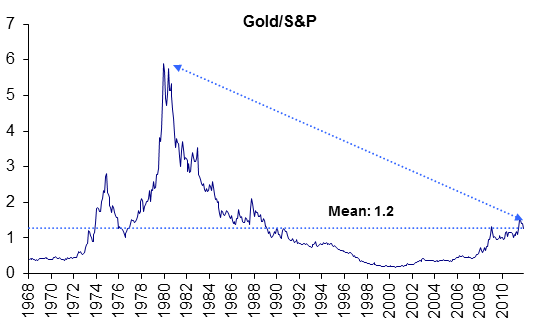
As is clear from the graph, the current gold/S&P ratio is only just above the long term mean of 1.2. In order to reach the 1980s ratio of 6, the gold price (again, according to Mr Stoeferle) would have to reach in excess of $8,500..."
at http://www.marketoracle.co.uk/Article32965.html
Rather than looking at the nominal prices, Mr Stoeferle has decided to carry out comparisons against monetary aggregates and other asset classes. This is key in gold price analysis as it puts the price of the metal into perspective alongside fundamentals which are heavily influenced by both monetary policy and confidence in the economy.
Measuring gold price against M2 money supply

The first chart shows the Gold/M2 ratio. The ratio currently trades at 0.16, which as Mr Stoeferle points out:
- Is nowhere near the ratio at which the last bull market ended in 1980 which traded at 0.47
- Bull markets do not end ‘around the long term median, they end in extremis’
Measuring gold price against the MZM supply

MZM, the Money Zero Maturity measure, measures the liquid money supply in an economy. For some countries it is the preferred money supply as it measures the money which is readily available in the economy.
This demonstrates the difference between the value of gold and the money supply as even more extreme version of the earlier graph; the ratio of gold price to MZM is trading at the long term mean of 0.16. This again, is significantly off the 1980 ratio of 0.8.
Mr Stoeferle states that in order for the 1980 ratio to be matched today, the gold price would need to increase to $8,500.
Measuring the gold price against the S&P 500

As is clear from the graph, the current gold/S&P ratio is only just above the long term mean of 1.2. In order to reach the 1980s ratio of 6, the gold price (again, according to Mr Stoeferle) would have to reach in excess of $8,500..."
at http://www.marketoracle.co.uk/Article32965.html